🗽 NYC Subway Ridership Prediction based on Weather and Holidays 🚇🌦️
28 Apr 2025
Reading time ~3 minutes
Introduction & Problem Definition
Weather conditions significantly influence public transportation usage, but the extent of this impact remains understudied. In New York City—where millions rely on the subway daily— understanding how factors like temperature, precipitation, and holidays affect ridership can empower transit planners to optimize service and help commuters make informed travel decisions. This end-to-end project integrates real world data, performs advanced data visualization and predictive modeling (machine learning), and quantifies these relationships to predict subway ridership under varying weather conditions and holidays.
We plan to achieve following things in this project:
-
Datasets & Preprocessing
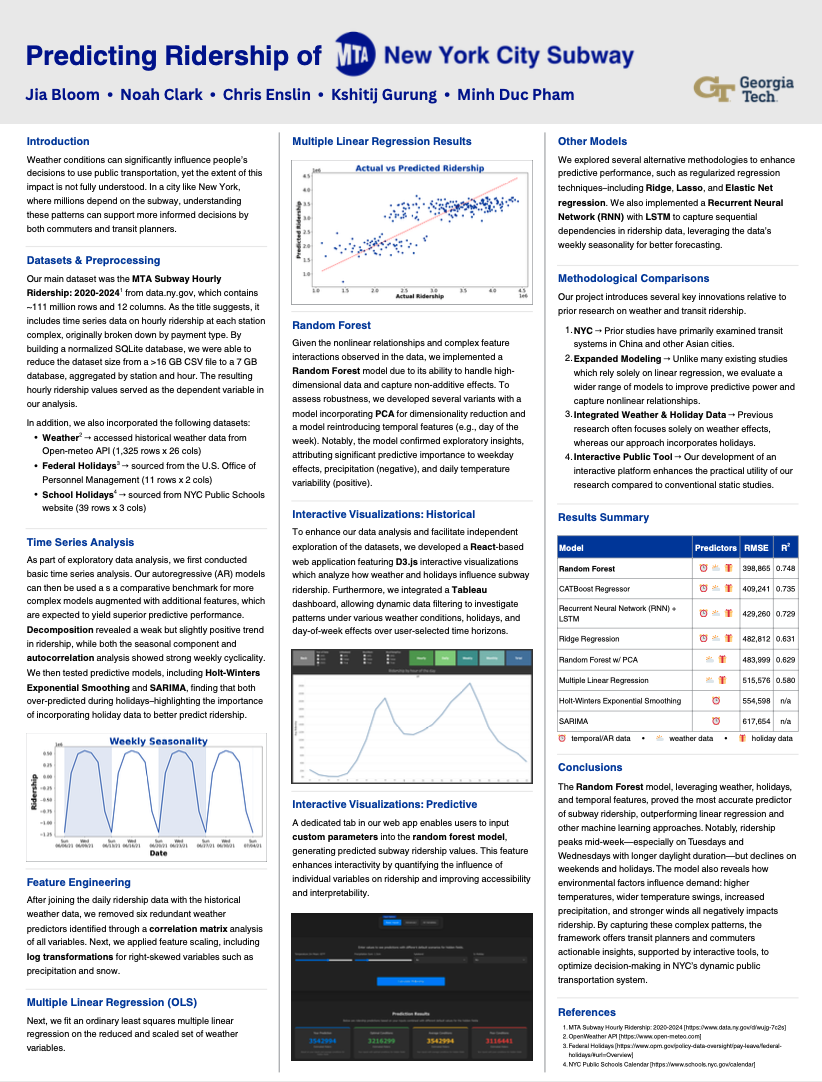
- Our main dataset was the MTA Subway Hourly Ridership: 2020-2024 from data.ny.gov, which contains ~111 million rows and 12 columns. It includes time series data on hourly ridership at each station complex, originally broken down by payment type. By building a normalized SQLite database, we were able to reduce the dataset size from a >16 GB CSV file to a 7 GB database, aggregated by station and hour. The resulting hourly ridership values served as the dependent variable in our analysis.
- In addition, we also incorporated the following datasets:
- Weather → accessed historical weather data from Open-meteo API (1,325 rows x 26 cols)
- Federal Holidays → sourced from the U.S. Office of Personnel Management (11 rows x 2 cols)
- School Holidays → sourced from NYC Public Schools website (39 rows x 3 cols)
- Exploratory Data Analysis and Feature Engineer
- Performed Descriptive data analysis, created scatter plots, historgrams, box plots to understand the data distribution
- Built correlation heat maps, conducted VIF analysis, and leveraged dimension reduction techniques to perform feature selection
- Created feature engineered variables such as temperature range, temporal (consin, cyclical features), and transformed (log) skewed features suchash precipitation and snow
- Time series Analysis
- Built autoregressive (AR) models that can then be used as a comparative benchmark for more complex models augmented with additional features, which are expected to yield superior predictive performance.
- Decomposition revealed a weak but slightly positive trend in ridership, while both the seasonal component and autocorrelation analysis showed strong weekly cyclicality.
- Built Holt-Winters Exponential Smoothing and SARIMA, finding that both over-predicted during holidays–highlighting the importance of incorporating holiday data to better predict ridership.
- Predictive Modeling (Machine Learning)
- We trained many ML models (parametric and non-parametric) to capture complex real world patterns.
- Parametric models: Multiple Linear Regression (OLS), Regularized Regression (Ridge, Lasso, Elastic Net), Recurrent Neural Networks (RNNs) plus Long Short-Term Memory networks (LSTMs)
- Non-Parametric models: Tree based (Decision Tree, Random Forest, XGBoost, CATBoost), PCA Regression
- We trained many ML models (parametric and non-parametric) to capture complex real world patterns.
- Data Visualization
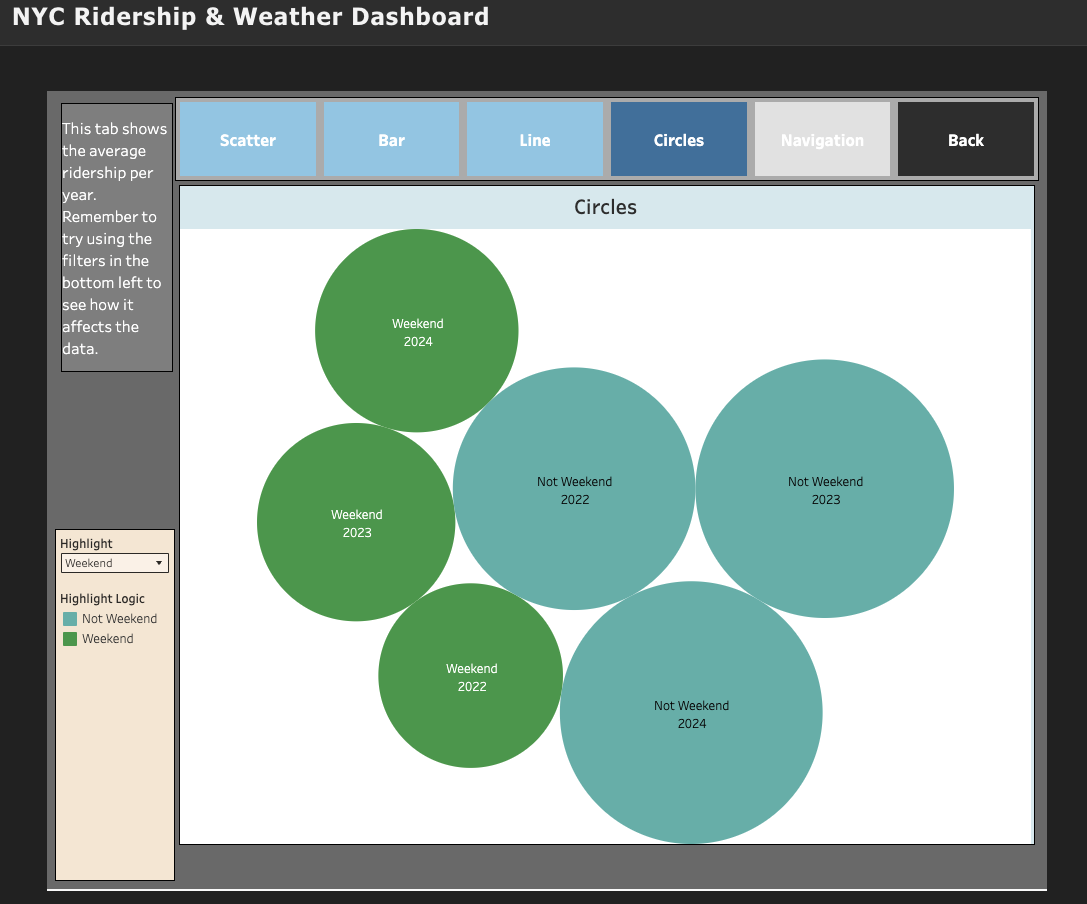
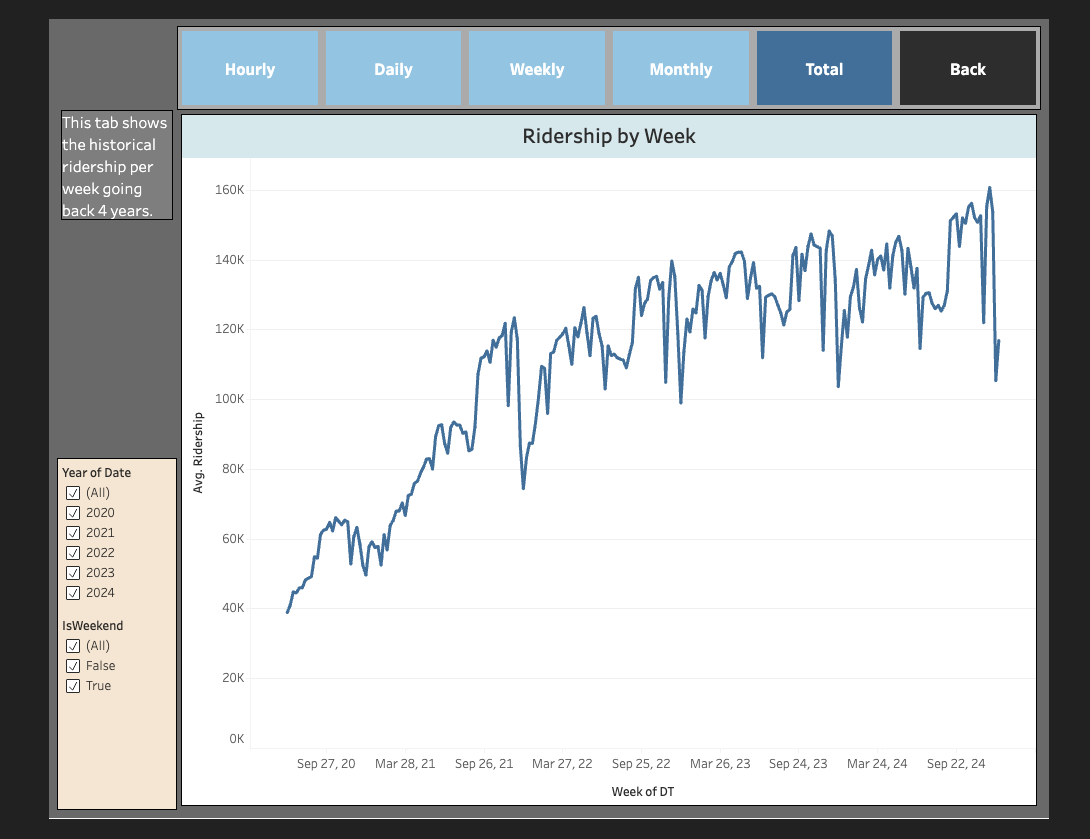
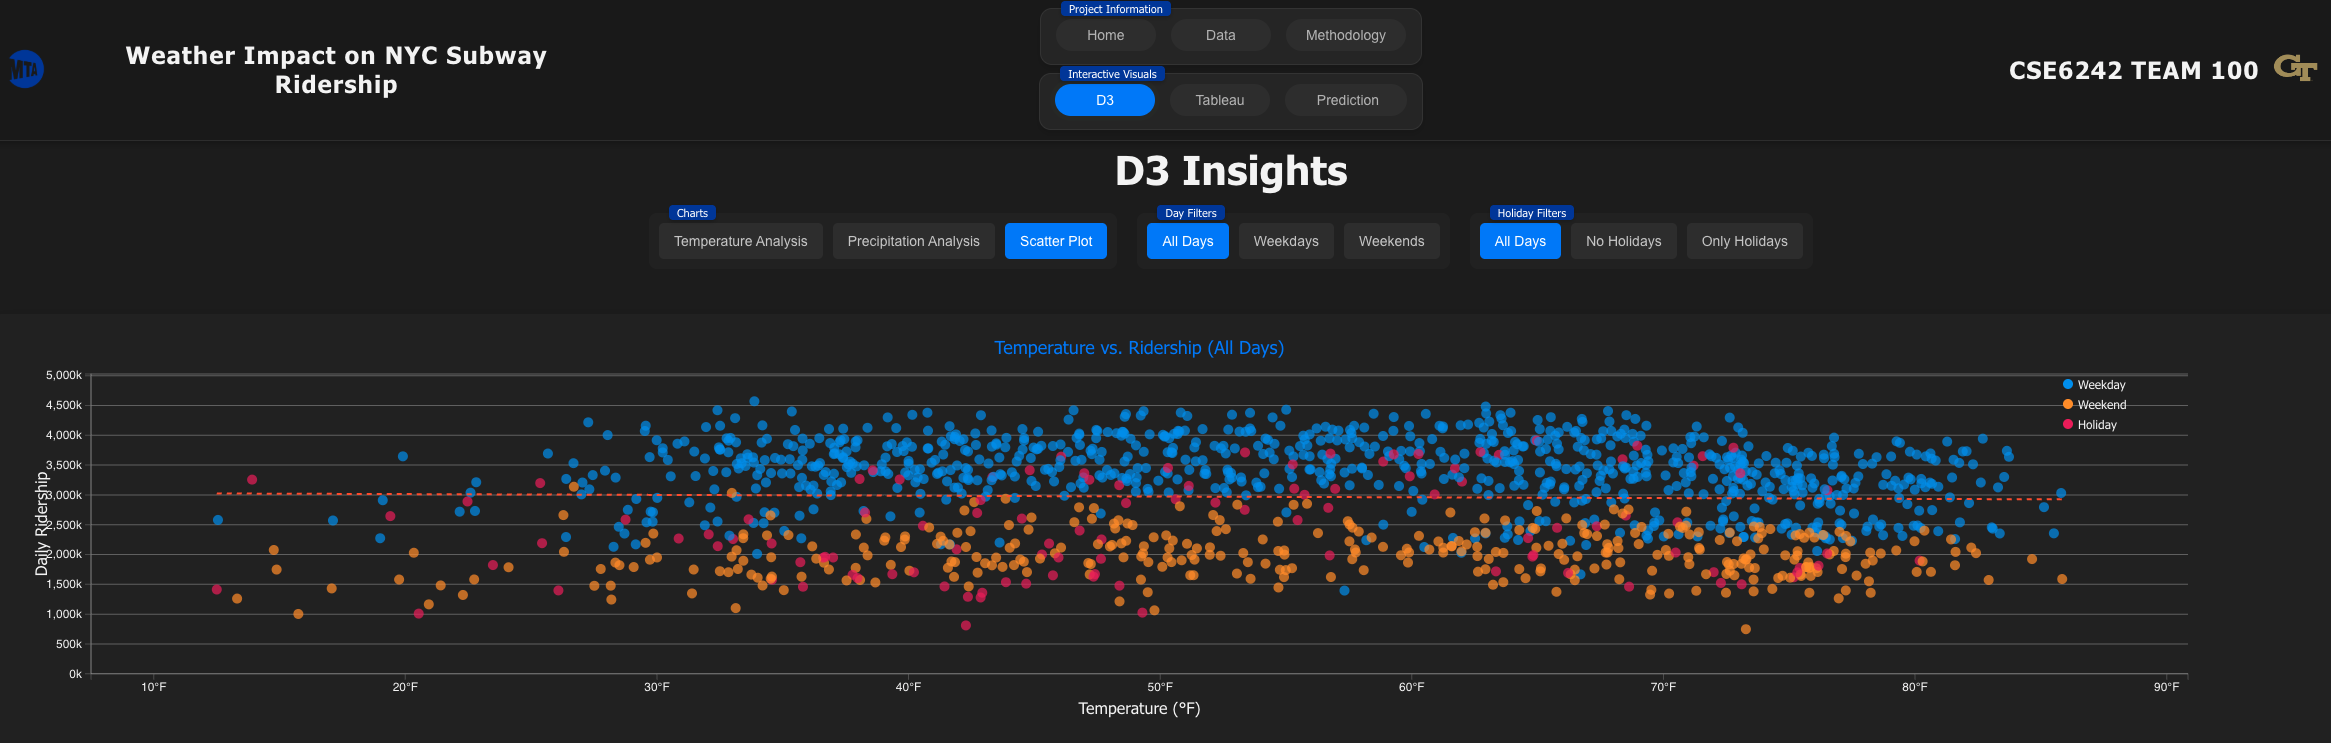
- Developed interactive D3.js and Tableau visualizations, which is great for end-users to explore around (for EDA and descriptive analysis)
- Model Evaluation and comparison.
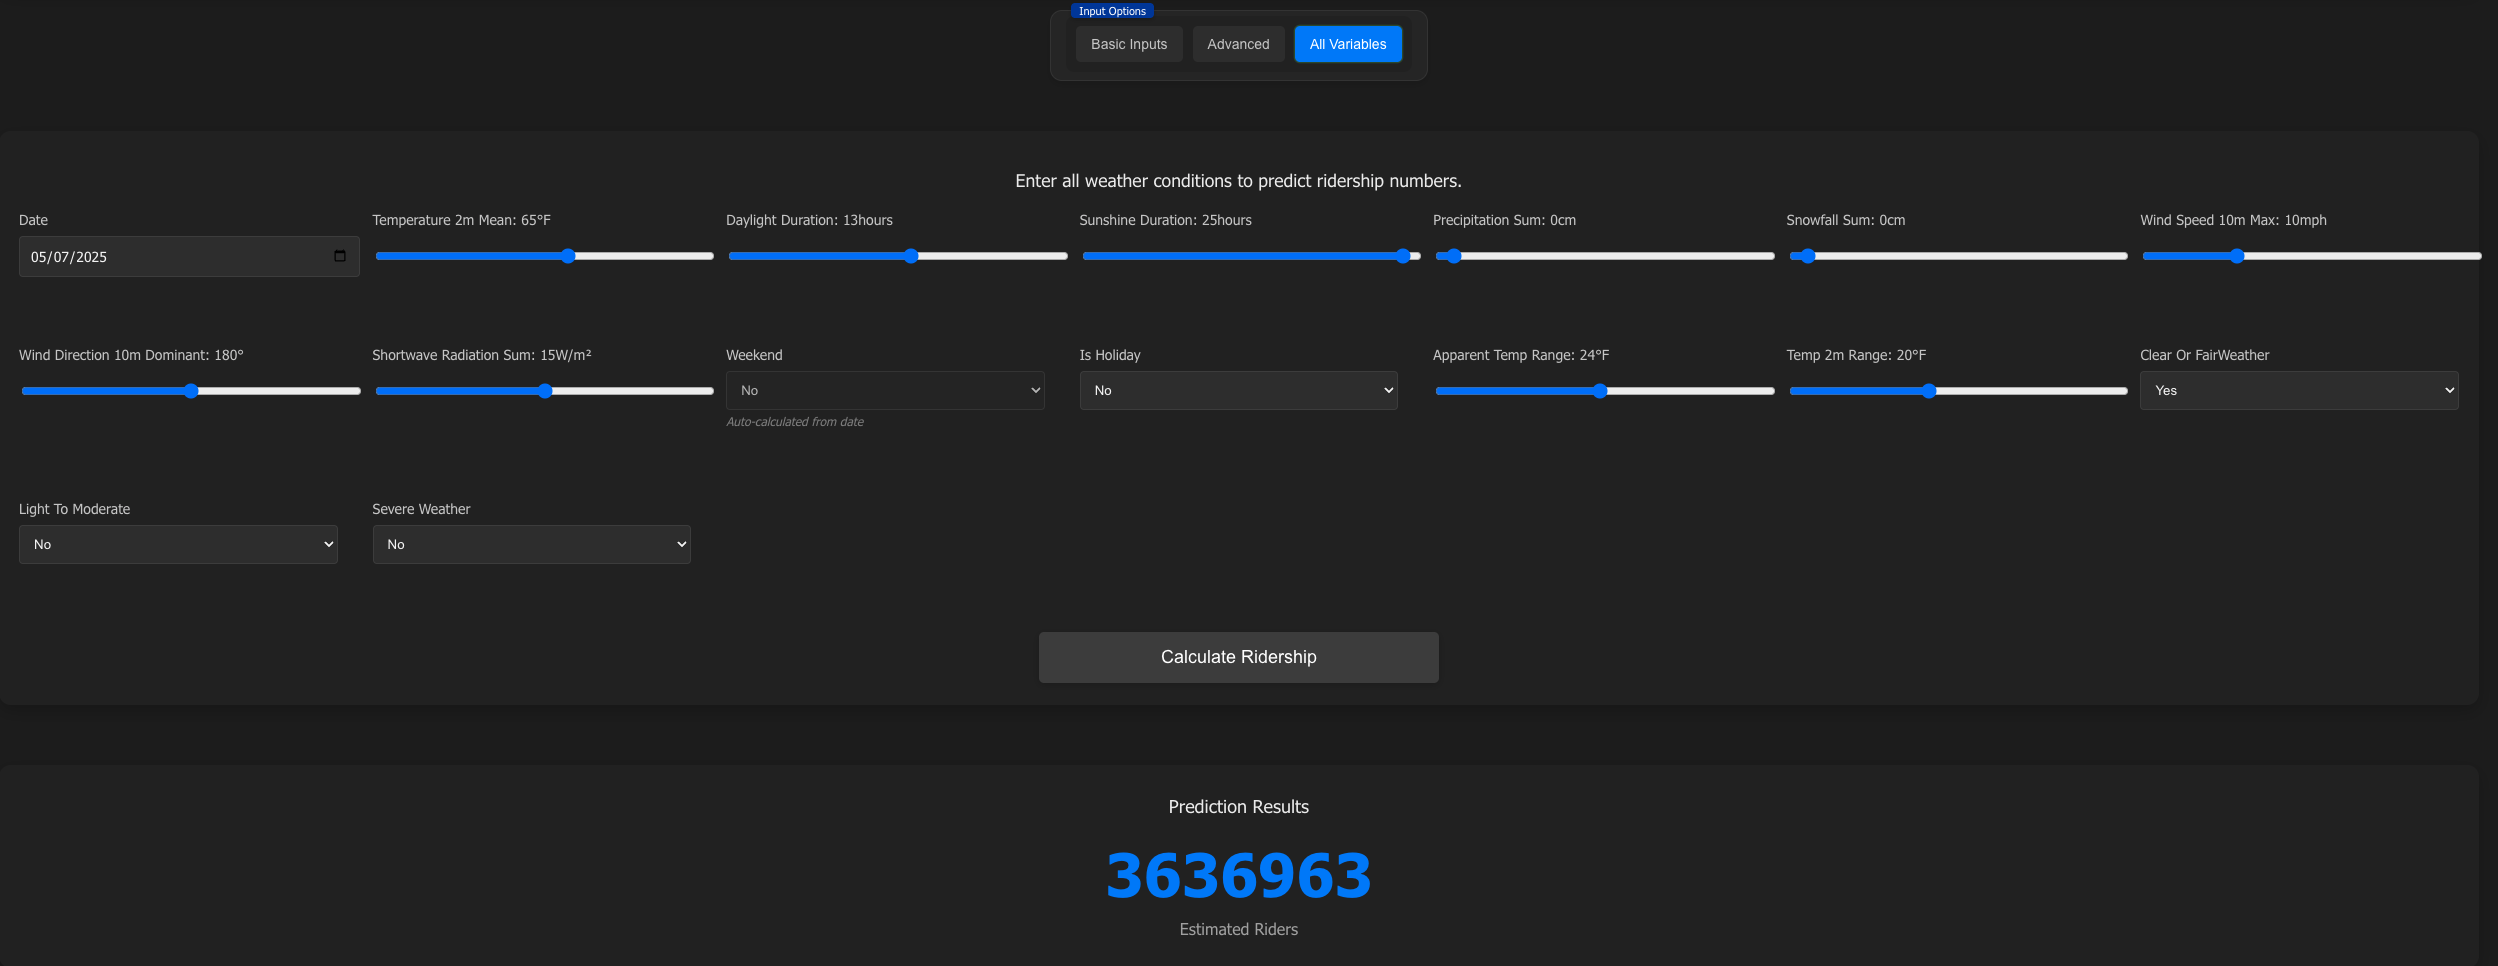
- Deployed our best model (Random Forest with Temporal Feature) in Reach Web App for Inference/Prediction
- Conclusion and Results
- Build a React WebApp to consolidate our entire project
How users can get started with the project?
- README.md will get you started right away! 🚀
- Link to the Github project repo for all the Nuts and Bolts 🛠️⚙️
- Folder structure
- ridership-data: Ridership data and the code used to process it
- weather-data: Code for gathering weather data and preprocessing
- linear-regression-models: Initial base regression model establishing correlation between weather and ridership
- advanced-prediction-models: Advanced Random Forest model that improved upon the linear regression approach
- time-series-analysis: Jupyter notebook containing time series analysis of the data
- ridership-prediction-app-frontend: React-based frontend with static pages and interactive dashboards using D3.js and Tableau visualizations
- ridership-prediction-app-backend: Flask-based backend using the Random Forest model to calculate ridership based on weather data
- ridership-prediction-app-heroku: Combined frontend and backend files for Heroku deployment
- Folder structure
D3 visualizations
Ridership Prediction Model Inferencing
Poster and more visuals